Every college football game on The Margin shows two numbers: ours and the market's. Ours comes from a model we built ourselves, and this is how it gets made. It is the short version. It leaves out the weights and the fine print, but every step below is a step the real model takes.
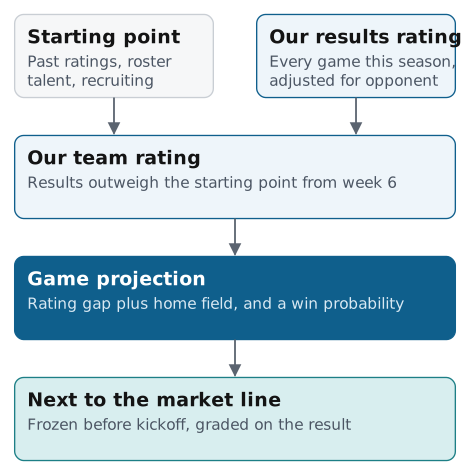 Tap to open full size, or swipe to pan.
Step 1: a preseason rating
Before a game is played, we need a starting point for every team. For that we look back: where four public rating systems (SP+, ESPN's FPI, SRS and a college Elo rating) had each team over the last three seasons, weighted toward last year and pulled back toward average. On past seasons that mix predicted margins better than SP+ on its own. We then adjust it for each roster's talent and recruiting and for first-year head coaches. That is all the outside ratings do: set where each team starts in August.
Step 2: this season's results
This is the heart of the model, and it is entirely ours. Every completed game goes into a rating we fit on this season alone. It looks at each final margin and adjusts for who the opponent was, so beating a strong team by 10 counts for more than beating a weak one by 10. Games against FCS teams count too, with the FCS side treated as one shared opponent.
Step 3: one team rating
The two are blended. In week 1 the starting point is all there is. Each week our results rating gets more of the weight, and from week 6 on it counts for more than the starting point. That is why the ratings on college football ratings move every week instead of sitting where they were in August.
Step 4: the projection
The projected margin is the gap between the two teams' ratings, plus home field. At a neutral site there is no home field. The win probability comes from that margin and from how far college results usually land from a projection. When we can't rate one of the two teams, which is mostly FCS opponents, the game gets no number from us.
Some things are left out on purpose. We tested a separate conference-strength term, and it didn't help: the preseason rating already carries how strong each league is. The betting line isn't an input either, with one exception: North Dakota State and Sacramento State are new to FBS this year and had no rating history, so their starting points came from their first betting lines. Their own results take over from there like everyone else's.
Step 5: next to the market
That projection is the Model number on the college game board. The market's line, from DraftKings and ESPN, sits beside it, and the gap is the points between them. Each week's projections freeze before the first kickoff, and the frozen number is the one we grade.
How close does it get? On past seasons, run as if each week were live, the model's average miss on the final margin has been about a point larger than the closing line's. Getting close to the closing line is the goal. The record shows how close we are this season.
The same ratings drive the season simulation behind the playoff and title odds on the college football page. Game totals come from separate models and are shown as a range, not a single number.
Follow The Margin
New analysis lands here first. Subscribe by RSS or follow @themarginsports on X.
Keep reading
More from The Margin
All analysis- We rated every college quarterback. Then we learned the Heisman isn't a quarterback award.
Jesse McConnell, Jun 29, 2026. CFB, 8 min read
There's no public EPA in college past 2021, the schedules are a free-for-all, and the biggest award is decided by story as much as by snaps. So we built an opponent-adjusted rating that survives all three, then learned that predicting the Heisman means measuring the team, not just the quarterback, and that even then a stubborn slice of the trophy is pure narrative.
- Which NFL teams have the most future Hall of Famers?
Jesse McConnell, Oct 14, 2026. NFL, 7 min read
We built a Hall of Fame monitor from 29 draft classes, gave quarterbacks their own model, and scored all 1,972 players on 2026 rosters. The 49ers, Rams and Steelers each carry about four future Hall of Famers. Teams with more of them have won more, but the number describes a roster; it doesn't forecast one.
- Should Denver pick up Bo Nix's fifth-year option? Yes. The extension is the hard part.
Jesse McConnell, Oct 12, 2026. NFL, 6 min read
Bo Nix's market rate is $46.0M a year, with a range of $31M to $61M. His 2028 option is projected at $30.0M. Pick it up. An extension would likely cost more than our number: young starters got more than the model said in 5 of 6 recent deals.