Power is the fast lane in baseball. Steven Kwan takes the back roads.
We split every pitch of the last five seasons into the parts a hitter controls: swing decisions, contact, power, speed and baserunning, with every ballpark evened out. Power is worth the most, by a lot. But per plate appearance and with luck stripped out, Mookie Betts has been one of the 15 most valuable hitters in baseball since 2022 with below-average power, and Steven Kwan had the best plate approach in the game this year.
This started with a simple question: who draws the most walks in baseball?
Yordan Álvarez led the majors this season with 109. But 33 of them were intentional. That's pitchers being afraid of him, not a sign of a great eye. The hitter most fans would name for a great eye, Steven Kwan, drew 85 walks and struck out only 62 times. Not counting intentional walks, he was one of three qualified hitters who walked more than he struck out.
Walk totals mix together a lot of things that aren't discipline: how often a hitter played, whether pitchers wanted to face him, who hit behind him. So we asked a bigger question. How many runs does each part of hitting actually produce?
Baseball has its own EPA
Every pitch changes how many runs the batting team should expect to score in the inning. That depends on the count, the outs and the runners. A first-pitch ball adds about +0.04 runs. A first-pitch called strike takes away about −0.04. In 2026 a home run was worth +1.53 runs on average, a single +0.45 and a walk +0.24. Statcast publishes this value for every pitch, so it works the same way EPA does in football: add it up and you get a hitter's total.
The total on its own doesn't say how a hitter produced his runs. So for every pitch in the last five regular seasons, about 3.6 million of them, we asked what an average hitter gets from that exact pitch: same location, same count, same handedness. Then we measured each hitter against that average and split the difference into parts:
- Swing decisions: swinging at the right pitches and taking the wrong ones.
- Contact: once he swings, whether he misses, fouls it off or puts it in play.
- Power: what a ball in play is worth from how it was hit: exit velocity, launch angle, pull or opposite field. Measured in an average ballpark.
- Legs: what his sprint speed adds to that same contact. Beaten-out grounders, extra bases on his own hits, double plays avoided.
- Baserunning: stolen bases and taking the extra base on someone else's hit, from Statcast's baserunning run value.
- Luck: what actually happened minus what that contact, that runner and that ballpark usually produce. Bloops, line drives right at someone, good defense.
- Other: hit by pitches and close calls on pitches he took.
The parts add up exactly to the total. Intentional walks are left out.
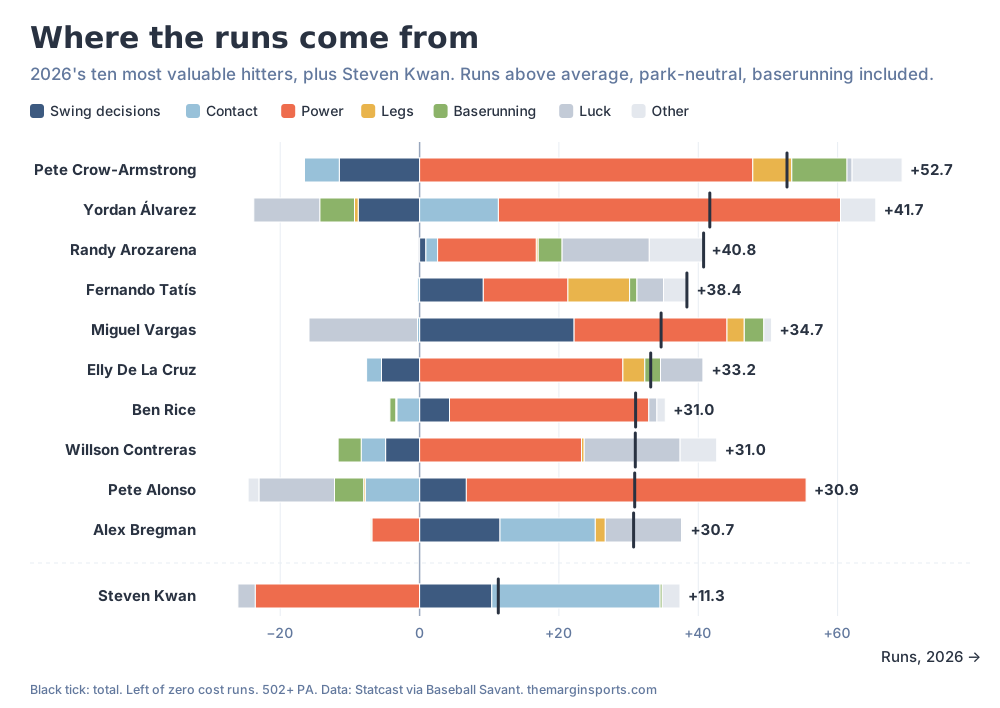 Tap to open full size, or swipe to pan.
Pete Crow-Armstrong was the most valuable hitter in baseball this season, at +52.7 runs. Power did most of it (+47.8), and he added 13.5 more with his legs and on the bases. His swing decisions cost him 11.5 runs. Álvarez was second at +41.7: +49.1 from power, −8.8 from swing decisions and −5.0 on the bases. Neither one is picky at the plate, and it barely matters.
Kwan is the mirror image. His swing decisions and contact added up to +34.5 runs, the most in the majors. His power took away 23.6. His total: +11.3, 62nd of 135 qualified hitters.
Power is the fast lane
Put power on one axis and everything else on the other, both per 600 plate appearances so part-time players compare fairly. Luck is left out of both, since it doesn't repeat, so this is what a hitter's skills are worth. Every hitter on the same diagonal line is worth the same. The chart covers the 227 hitters with at least 1,500 plate appearances since 2022.
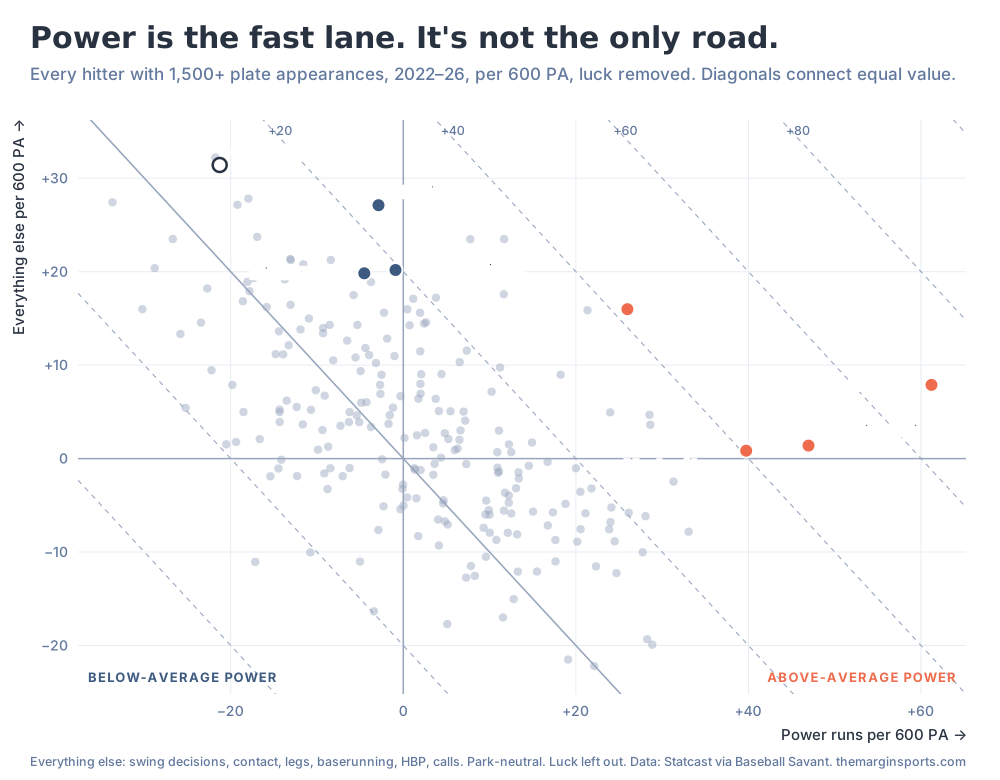 Tap to open full size, or swipe to pan.
The two axes push against each other. Hitters who hit the ball hard tend to miss more often, and hitters who make a lot of contact tend to hit it softer. Across these 227 hitters, power and everything else have a correlation of −0.54.
Power is still the fastest route to the top. Aaron Judge is worth +69.1 runs per 600 plate appearances, and +61.2 of that is power. Shohei Ohtani is second. All four hitters marked in orange are worth +40 or more per 600, and power is the biggest piece for each of them.
But power isn't the only route. 10 of the 68 hitters worth +10 or more per 600 plate appearances got there with below-average power. Mookie Betts is the best of them: +24.2 per 600, 15th of 227, with power almost exactly average (−2.9). George Springer (+19.3) and Miguel Vargas (+15.3) are in the same corner.
Kwan is as far up that corner as anyone gets. Over five seasons, his everything-else number is +31.4 per 600 plate appearances, second only to Nico Hoerner. His power is −21.3, the 11th-lowest. Put together he's a solidly above-average hitter (+10.1 per 600, 68th of 227), and he got there almost entirely without hitting the ball hard.
Chase it, crush it
Chasing usually costs runs. The swing-decisions part charges a hitter for every pitch he swings at out of the zone. Some hitters win a lot of it back anyway.
Randy Arozarena and Ohtani were essentially tied for the most runs from balls they put in play on pitches outside the zone this season, +15.5 each. Over five seasons, Bobby Witt Jr. and Rafael Devers are tied at the top (+52.1), with Álvarez third. So yes, you can swing at a bad pitch and still knock it out of the park. It's just a short list of people who do it often.
Which parts are skill?
A part that repeats from one season to the next is mostly skill. One that doesn't is mostly noise. We checked 555 cases of the same hitter in back-to-back seasons with 400 or more plate appearances each.
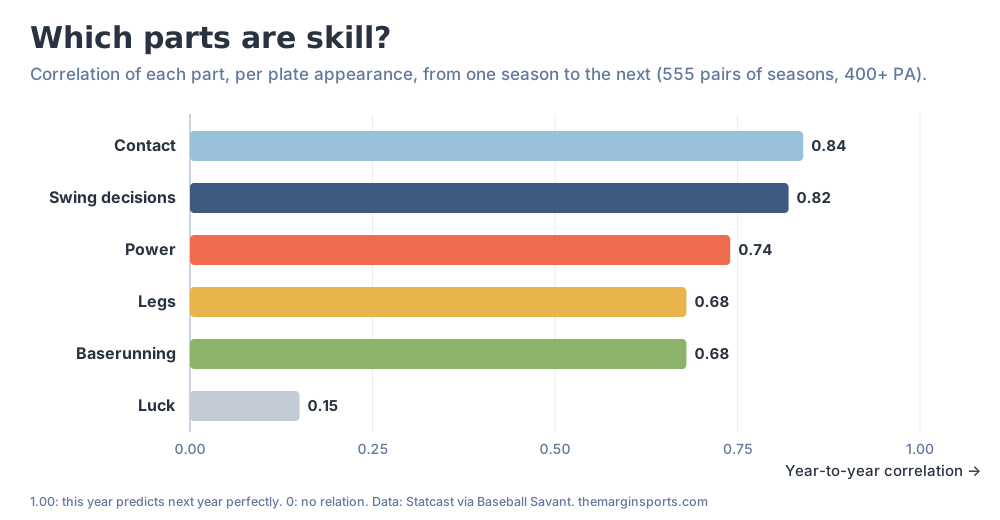 Tap to open full size, or swipe to pan.
Contact (0.84) and swing decisions (0.82) are the most stable things a hitter does. Power (0.74), legs (0.68) and baserunning (0.68) are close behind. Luck (0.15) barely carries over at all.
That makes luck useful. James Wood hit the ball well enough this season to earn +40.5 runs from power. Bad luck took 15.2 of them back. Pete Alonso lost 10.8 the same way. If their contact holds, both will likely look better next year without changing a thing.
It also explains Taylor Ward. His swing decisions were third-best in baseball this season (+19.5). His power cost him 14.5 runs. He finished slightly below average (−3.9): great eye, nothing to do with it.
The robot umps erased a skill
Some hitters used to get the close calls. On pitches an average umpire could call either way, a few hitters got called balls far more often than the location and count said they should, and they did it every year. From 2022 through 2025, a hitter's extra balls on borderline pitches in one season predicted the next season's with a correlation of about 0.5. That's a real, repeatable trait. Hitters with taller strike zones got more of those calls as balls.
Ryan McMahon was the master of it. He earned between +4.3 and +5.5 runs a year from borderline calls from 2022 through 2025, about 30 extra balls a season. Over five years that's +20.2 runs, the most of any regular.
Then the ABS challenge system arrived this season, and the skill nearly vanished.
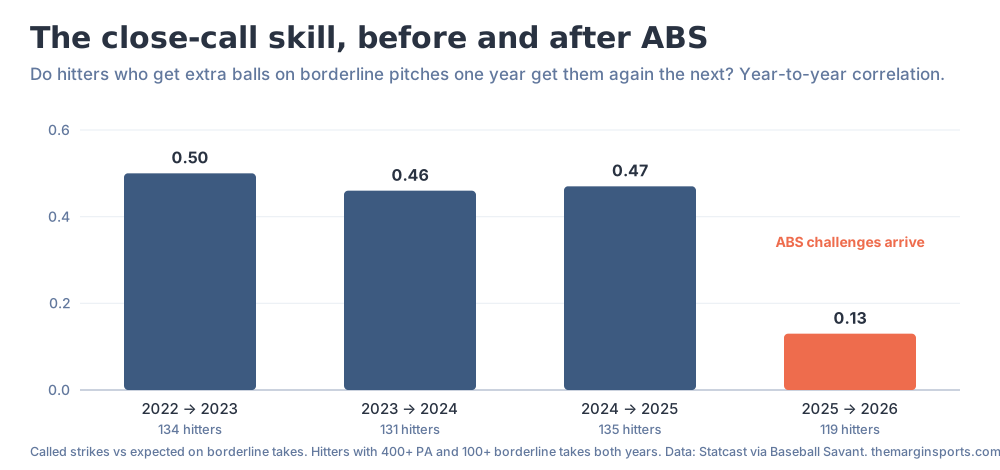 Tap to open full size, or swipe to pan.
The correlation from 2025 to 2026 fell to 0.13. There were also far fewer genuinely uncertain takes: about 43,000 this season, down from around 60,000 a year before. The average qualified hitter's swing from close calls dropped by about a third. McMahon got +0.7.
We can't tell from this data whether hitters used to earn those calls with a great eye, a reputation or a stance umpires read a certain way. We can tell that once a pitch could be challenged, it mostly stopped mattering.
What this can't tell you
-
It's offense only. Defense and position aren't in here, so a Gold Glove shortstop gets no credit for his glove. That would take a different post.
-
The park adjustment covers batted balls. Each ballpark is evened out for what it does to contact, which is where most of a park's effect lives. This season the Athletics' park in Sacramento, Coors and Fenway inflated contact the most. San Diego, St. Louis and Minnesota held it down the most. Parks also nudge strikeout and walk rates a little, and that part isn't adjusted.
-
Baserunning is Statcast's number, not ours. It's built around runners already on base: steals and extra bases on someone else's hit. Legs covers the hitter running out his own ball, so the overlap should be small.
-
The baseline is our model. The average behind each pitch comes from our own model of five seasons of Statcast data, fit separately for each season. We checked it three ways:
- Each hitter's raw run total matches Baseball Savant's published number (correlation 0.999 for 2026).
- Those raw totals also line up with wRAA, the standard batting-runs stat built from official box scores (0.98 across 673 qualified seasons, about 3 runs apart on average).
- An independent rebuild with a different method matched swing decisions and contact at 0.98 or better, and luck at 0.88. That rebuild doesn't separate speed and park from luck. With those added back in, it matches at 0.95.
Other reasonable choices would still move individual numbers by a few runs.
The short version: power covers a lot of sins. Without it, you have to be very good at everything else. Steven Kwan is.
Follow The Margin
New analysis lands here first. Subscribe by RSS or follow @themarginsports on X.
Keep reading
More from The Margin
All analysis- Which NFL teams have the most future Hall of Famers?
Jesse McConnell, Oct 14, 2026. NFL, 7 min read
We built a Hall of Fame monitor from 29 draft classes, gave quarterbacks their own model, and scored all 1,972 players on 2026 rosters. The 49ers, Rams and Steelers each carry about four future Hall of Famers. Teams with more of them have won more, but the number describes a roster; it doesn't forecast one.
- Should Denver pick up Bo Nix's fifth-year option? Yes. The extension is the hard part.
Jesse McConnell, Oct 12, 2026. NFL, 6 min read
Bo Nix's market rate is $46.0M a year, with a range of $31M to $61M. His 2028 option is projected at $30.0M. Pick it up. An extension would likely cost more than our number: young starters got more than the model said in 5 of 6 recent deals.
- Team EPA per play is free on The Margin now. Here's what it says about who wins Super Bowls.
Jesse McConnell, Oct 6, 2026. NFL, 5 min read
Offense and defense EPA per play for all 32 teams, free, on the team ratings page and every team file. Since 2015, 8 of 11 champions were above average on both sides of the ball, and none was below average on both.