Every NFL game on The Margin shows two numbers: ours and the market's. Ours comes from a model we built ourselves, and this is how it gets made. It is the short version. It leaves out the weights and the fine print, but every step below is a step the real model takes.
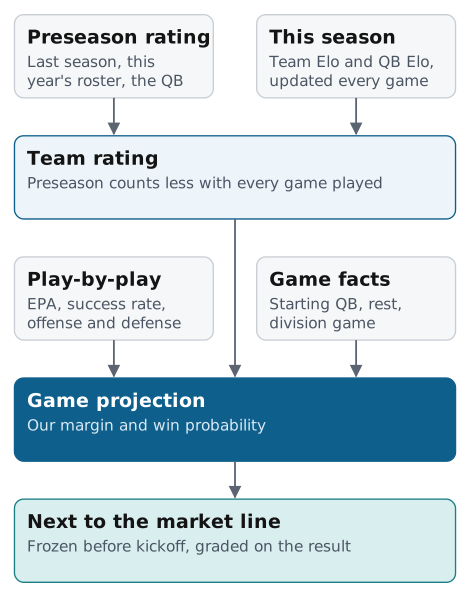 Tap to open full size, or swipe to pan.
Step 1: a rating for every team
Each team starts the season with a preseason rating. It begins from where the team finished last year, pulled back toward the league average. Then it accounts for the players on this year's roster and the quarterback in line to start.
Once games are played, a second rating comes in. It has two parts. A team Elo rating moves after every game, based on the margin of victory, the opponent and home field. Each quarterback has his own Elo rating, built from his own play: passing value, accuracy and rushing, adjusted for the defenses he faced. If a quarterback changes teams, his rating goes with him. Team Elo plus the starting quarterback's Elo is the rating you see on NFL team ratings.
The game model blends the two. In week 1 the preseason rating is all there is. It counts for less with every game played, and within a few weeks this season's results carry most of the weight.
Step 2: how each team plays
The rating says how good a team is. Play-by-play says how it plays. For each team the model tracks offense and defense over recent games: expected points added (EPA) per play, success rate, yards per play, pace, third-down conversions and red-zone touchdowns, plus the same numbers allowed on defense. Early in the season these lean on last season's games. They shift to this season's as games are played.
Step 3: the game itself
A few facts about the matchup go in as well: which quarterback is starting (read from the depth chart and injury report before the game), how much more rest one team has than the other, and whether it is a division game.
Step 4: the projection
All of that goes into a regression fit on past NFL seasons. It turns the differences between the two teams into a projected margin. We run two versions of it. One adds detailed inputs on the starting quarterbacks; the other doesn't. We publish the average of the two. The win probability comes from that margin and from how far real NFL results usually land from a projection.
Some things are left out on purpose. We tested whether offensive-line play improves the rating, and it didn't, so it isn't in. The betting line isn't an input either.
Step 5: next to the market
That projection is the Model number on the NFL game board. The market's line, from DraftKings and ESPN, sits beside it, and the gap is the points between them. Predictions freeze midweek, before the games, and the frozen number is the one we grade.
How close does it get? On 2020 to 2025 games, run as if each week were live, the model's average miss on the final margin was about a third of a point larger than the closing line's. Getting close to the closing line is the goal. The record shows how close we are this season.
The same team rating drives the season simulation behind Super Bowl odds, which plays out the schedule 50,000 times. Game totals are a separate model and are shown as a range, not a single number. The full write-up of the team and quarterback ratings is on the NFL game model methodology page.
Follow The Margin
New analysis lands here first. Subscribe by RSS or follow @themarginsports on X.
Keep reading
More from The Margin
All analysis- Which NFL teams have the most future Hall of Famers?
Jesse McConnell, Oct 14, 2026. NFL, 7 min read
We built a Hall of Fame monitor from 29 draft classes, gave quarterbacks their own model, and scored all 1,972 players on 2026 rosters. The 49ers, Rams and Steelers each carry about four future Hall of Famers. Teams with more of them have won more, but the number describes a roster; it doesn't forecast one.
- Should Denver pick up Bo Nix's fifth-year option? Yes. The extension is the hard part.
Jesse McConnell, Oct 12, 2026. NFL, 6 min read
Bo Nix's market rate is $46.0M a year, with a range of $31M to $61M. His 2028 option is projected at $30.0M. Pick it up. An extension would likely cost more than our number: young starters got more than the model said in 5 of 6 recent deals.
- Team EPA per play is free on The Margin now. Here's what it says about who wins Super Bowls.
Jesse McConnell, Oct 6, 2026. NFL, 5 min read
Offense and defense EPA per play for all 32 teams, free, on the team ratings page and every team file. Since 2015, 8 of 11 champions were above average on both sides of the ball, and none was below average on both.